
Transformando dados em inteligência prática
Inovação e eficiência com dados, através de IA, machine learning e storytelling de dados.
Liderança em BI
Projetos que conectam tecnologia e negócios.
Cultura data-driven para resultados efetivos.
Integrações corporativas que impulsionam eficiência.
Soluções inovadoras
Resultados lucrativos


Qual é seu momento atual com IA?
Transformando dados em soluções
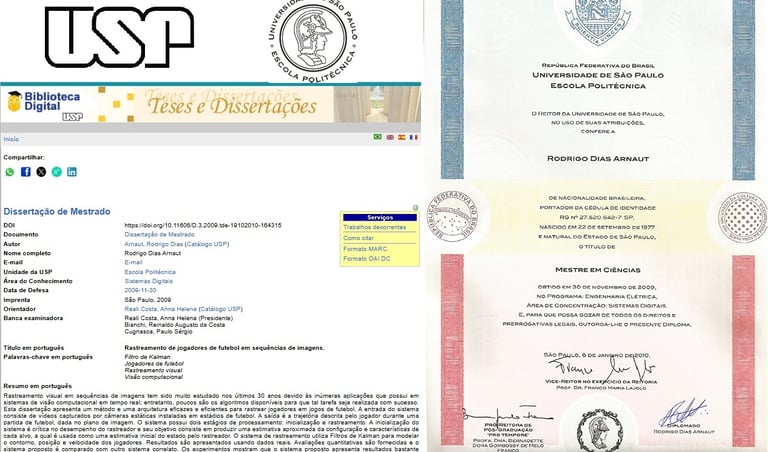
Rodrigo Arnaut é especialista em BI e Storytelling, com sólida experiência na liderança de times multidisciplinares focados em transformar dados em insights estratégicos. Atua na criação de soluções inovadoras e eficientes que integram tecnologia e objetivos de negócio, otimizando a tomada de decisão baseada em dados. Possui Mestrado em Inteligência Artificial pela Escola Politécnica da Universidade de São Paulo (Poli-USP), com ênfase em aplicações práticas de IA em ambientes corporativos.


Quem é o Arnaut?
Sou um gestor e especialista com mais de 25 anos de experiência em Business Intelligence, CRM, ETL e automação de dados, liderada por Rodrigo Arnaut, ex-executivo da Companhia das Letras e ex-líder de P&D na TV Globo. Atuo no desenvolvimento de soluções escaláveis com foco em inteligência de dados, IA, IoT e arquitetura de sistemas, com entregas para empresas como CNN, SEBRAE, DASA, Ambev, Ford e SBT.


Baixe o Currículo do Arnaut em PT/EN
CV simples


Podcast
O primeiro podcast 100% automatizado sem equipe de operação ou produção, 30 entrevistas (confira a playlist abaixo), 50 mil visualizações, 1 mil inscritos e 60 horas de conteúdo


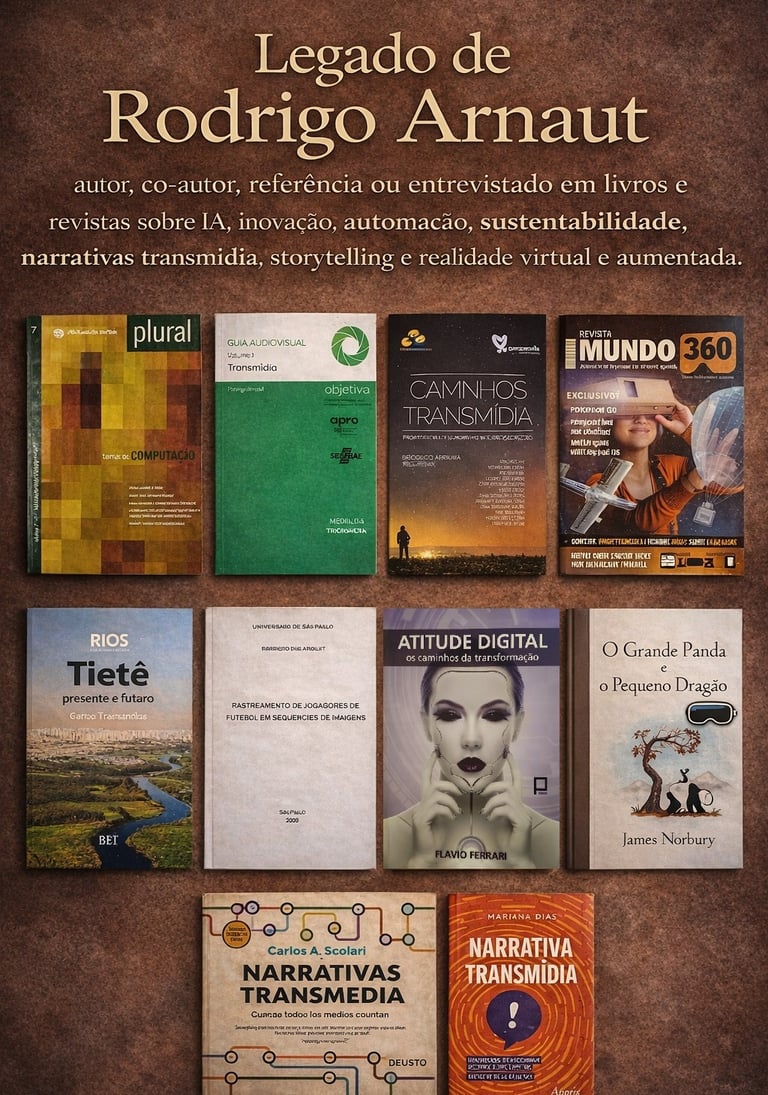
Livros & Autoria Arnaut com Contribuições e Menções
Transformamos dados em insights práticos para impulsionar seu negócio com inovação.


Consultoria em BI
Desenvolvemos soluções de Business Intelligence para decisões estratégicas e informadas.
Integrações Corporativas
Conectamos sistemas e processos para otimizar a eficiência e a colaboração.
Cultura Data-Driven
Promovemos uma mentalidade orientada a dados para resultados sustentáveis e impactantes.
Reconhecimentos
Alex Pimentel, CEO na Casablanca Online, em 27/03/2025: "Rodrigo é um profissional incrível, sempre antenado com as tecnologias mais recentes sem perder o lado humano. Desde que o conheci, muitos anos atrás, na Tv Globo e reuniões da SET (Engenharia de Televisão) temos mantido contato muito produtivo e de alto nível."
Thiago Quadros, Especialista em criação e planejamento de conteúdo multiplataforma, em 27/03/2025: "Rodrigo é um profissional excepcional, reconhecido por sua capacidade de inovar e gerar resultados únicos. Sua habilidade de liderança se destaca ao conduzir equipes multidisciplinares com eficiência e visão estratégica. Além disso, ele é um criador nato de oportunidades de negócios, aproveitando suas relações nos diversos ecossistemas em que atua."
Rafa Kassahara, Estagiário de TI - Monitor de Infraestrutura, em 09/04/2025: "Tive a oportunidade de ser supervisionado por Rodrigo Arnaut durante minha contribuição para a Esconderijo Criativo. Sua orientação técnica, clareza nas demandas e comprometimento com o desenvolvimento dos demais estagiários da empresa foram fundamentais para minha evolução profissional."
Aline Sordili, Inteligência Artificial | Transformação Digital | Comunicação & Marketing | Mentora | Professora e Palestrante, em 27/03/2025: "Trabalhar com o Rodrigo Arnaut é estar sempre ao lado da inovação. Ele tem uma capacidade única de conectar tendências emergentes com soluções práticas, sempre cumprindo os prazos com qualidade.
Rodrigo tem visão estratégica e, ao mesmo tempo, é mão na massa. Ele lidera projetos complexos com uma leveza admirável, sempre promovendo um ambiente colaborativo e criativo.
O lado humano do Rodrigo não pode ser deixado de lado: é generoso com seu conhecimento. Compartilha insights com clareza, tem escuta ativa e está sempre disposto a contribuir para o nosso crescimento, do time ou do ecossistema todo.

Recomendações
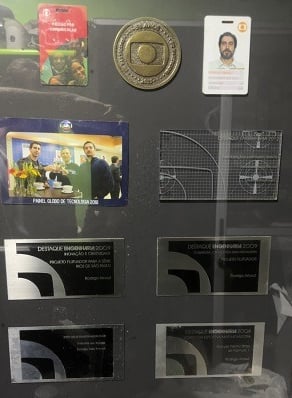
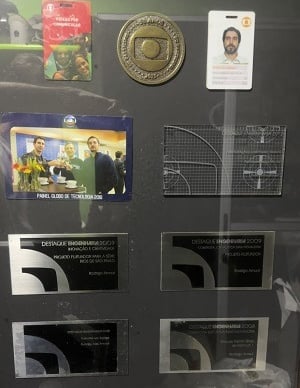
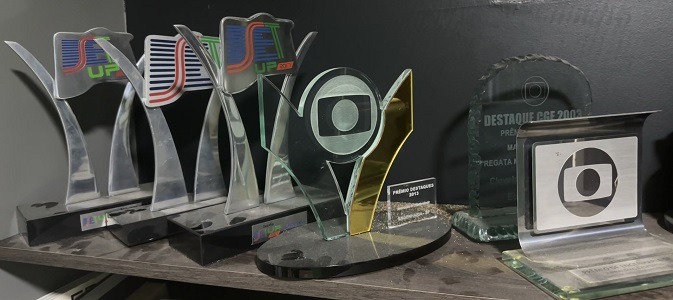
Premiações
Projetos Inovadores
Transformando dados em soluções práticas para o seu negócio.


Inteligência Prática
Conectando tecnologia e inovação para resultados efetivos.


Cultura Data-Driven
Promovendo decisões estratégicas baseadas em dados e insights.
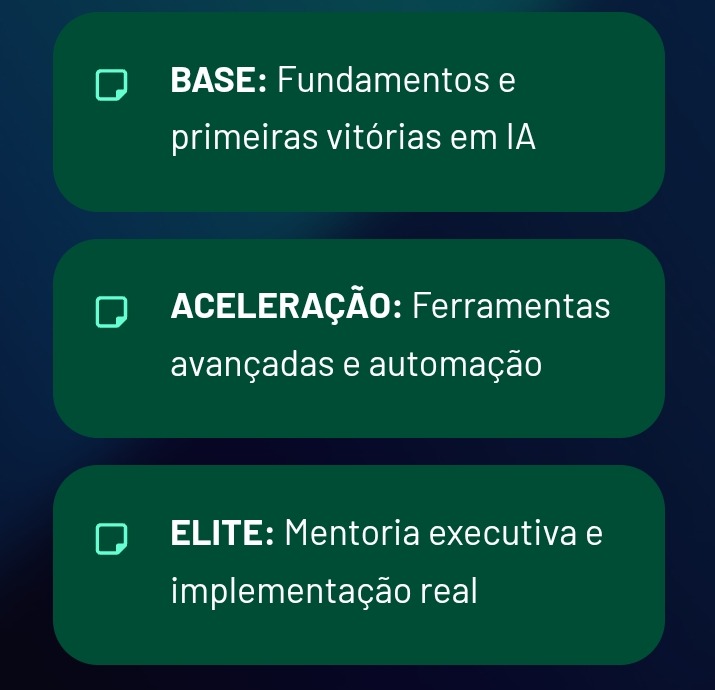
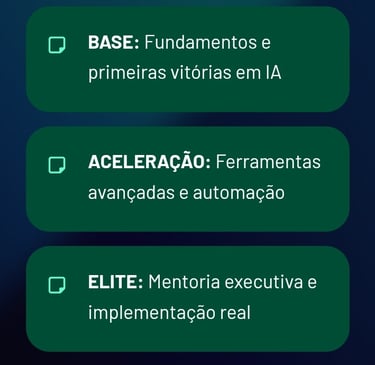
Clube do Arnaut - Trilhas da Rota 3D: Descubra, Decida e Desperte
R$ 499,00
ou 12 x R$ 41,59
(sem juros)


★★★★★